gut-health · 2 min read
A list of high fiber foods chart, by food group
This high fiber foods chart lists fiber per standard serving across legumes, grains, vegetables, fruit, nuts and seeds. Legumes run 12 to 19 g a cup, seeds 5 to 10 g an ounce, and most fruit and vegetables land between 3 and 8 g.
Written by Lifebar Desk · Checked against the sources listed below
Published 20 Sept 2026
Key takeaways
- Legumes occupy the top of every food group at 12 to 19 g per cooked cup.
- Seeds are the densest by weight, chia at roughly 10 g per 28 g ounce.
- Targets are 25 g a day for women and 38 g for men, against an average intake near 15 g.
- Two servings from the legume or seed rows covers most of the shortfall on their own.
Fiber charts are usually one long undifferentiated list, which hides the single most useful pattern in the data: the food groups are not close to each other. Splitting the chart by group makes the strategy obvious.
Legumes
| Food | Serving | Fiber |
|---|---|---|
| Navy beans, cooked | 1 cup | ~19 g |
| Split peas, cooked | 1 cup | ~16 g |
| Lentils, cooked | 1 cup | ~15.6 g |
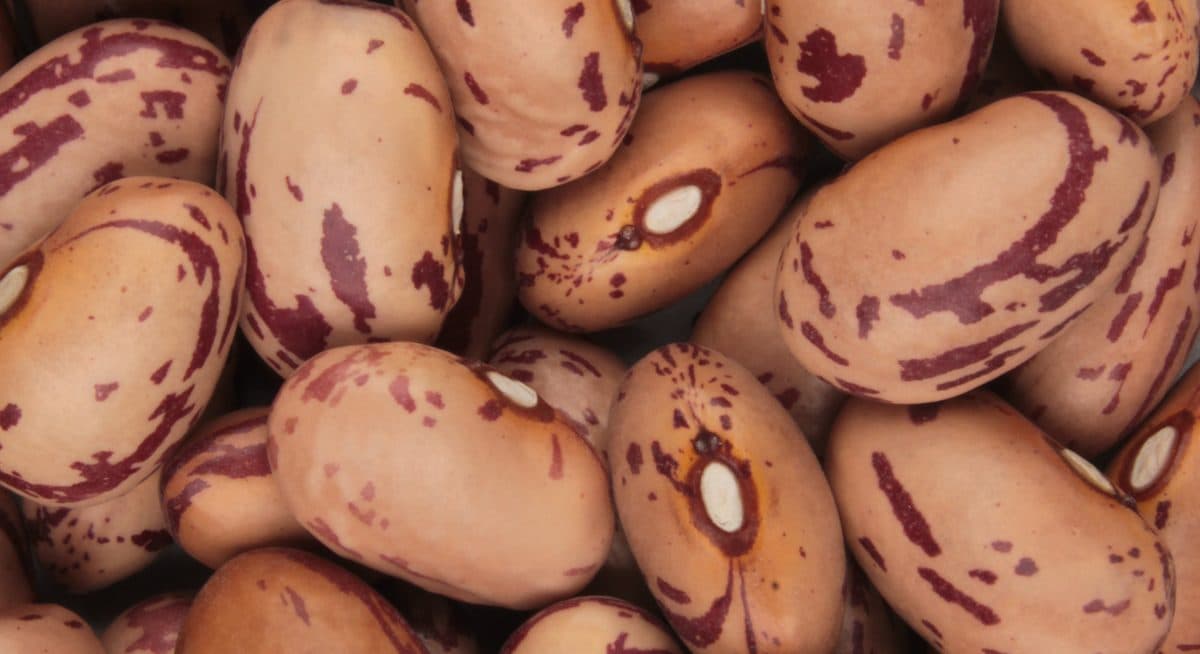
| Black beans, cooked | 1 cup | ~15 g |
| Chickpeas, cooked | 1 cup | ~12.5 g |
| Green peas, cooked | 1 cup | ~9 g |
Nuts and seeds
| Food | Serving | Fiber |
|---|---|---|
| Chia seeds | 1 oz (28 g) | ~10 g |
| Flaxseed, ground | 2 tbsp | ~4 g |
| Almonds | 1 oz | ~3.5 g |
| Pistachios | 1 oz | ~3 g |
| Walnuts | 1 oz | ~2 g |
Vegetables
| Food | Serving | Fiber |
|---|---|---|
| Artichoke, cooked | 1 medium | ~7 g |
| Winter squash, cooked | 1 cup | ~5.7 g |
| Broccoli, cooked | 1 cup | ~5 g |
| Collard greens, cooked | 1 cup | ~5 g |
| Spinach, cooked | 1 cup | ~4.3 g |
| Brussels sprouts, cooked | 1 cup | ~4 g |
| Sweet potato, with skin | 1 medium | ~4 g |
Fruit
| Food | Serving | Fiber |
|---|---|---|
| Raspberries | 1 cup | ~8 g |
| Blackberries | 1 cup | ~7.6 g |
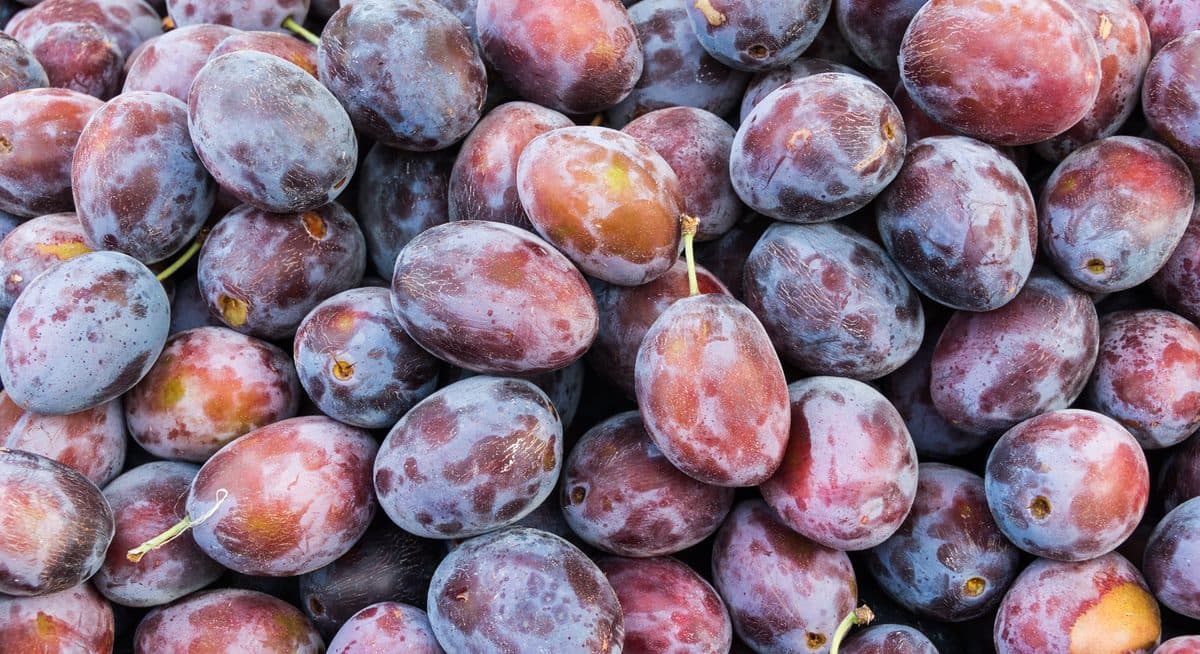
| Prunes | 1/2 cup | ~6 g |
| Pear, with skin | 1 medium | ~5.5 g |
| Avocado | 1/2 | ~5 g |
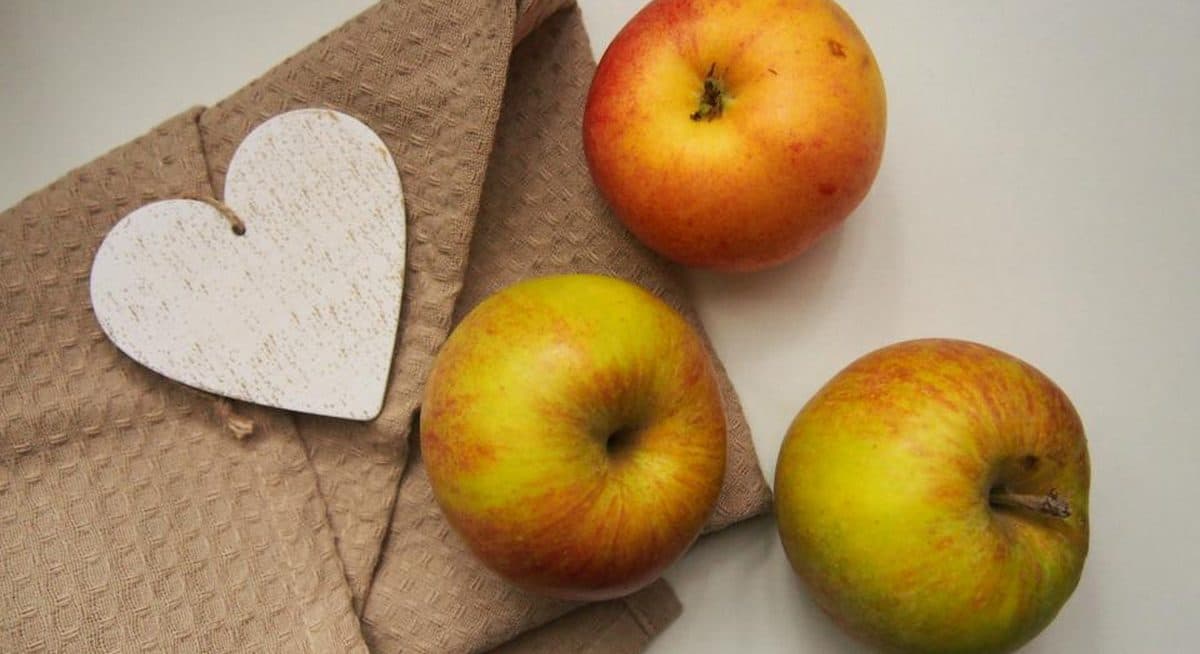
| Apple, with skin | 1 medium | ~4.4 g |
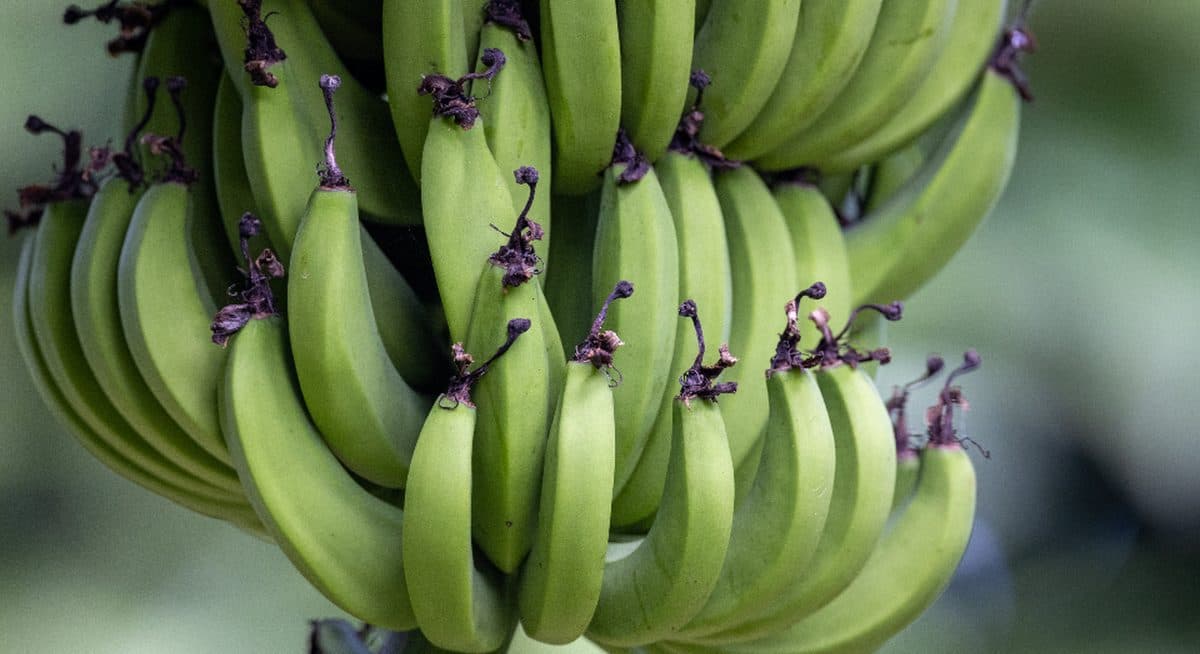
| Banana | 1 medium | ~3.1 g |
Grains
| Food | Serving | Fiber |
|---|---|---|
| Bulgur, cooked | 1 cup | ~8 g |
| Barley, pearled, cooked | 1 cup | ~6 g |
| Oats, cooked | 1 cup | ~4 g |
| Quinoa, cooked | 1 cup | ~5 g |
| Wholemeal bread | 1 slice | ~2 g |
| Brown rice, cooked | 1 cup | ~3.5 g |
How to read the chart
The targets are 25 g a day for women and 38 g for men. Average intake sits near 15 g, so most people are looking for another 10 to 20 g. One row from the legume table closes most of that gap by itself. Everything else is easier once that anchor is in place.
One caveat
Published values vary between databases, varieties and preparation methods. Treat these as working figures accurate to within a gram or so, not as laboratory measurements of the specific food in front of you.
Frequently asked
What are the top 10 high fiber foods?
By fiber per realistic serving: navy beans, split peas, lentils, black beans, chickpeas, chia seeds, green peas, raspberries, artichoke and pears. The first five are all legumes, which is the pattern the chart makes obvious.
How do I use a fiber chart day to day?
Find two or three rows you would actually eat regularly and build meals around them. Auditing every food is not sustainable; anchoring breakfast and one other meal to high-fiber staples is.
Do the numbers change with cooking?
Fiber itself is heat stable, but serving weights change a lot. A cooked cup of spinach holds several times the fiber of a raw cup because far more spinach fits in the measure. All cooked figures below are per cooked cup.
Sources
Educational content, talk to your clinician before changing treatment.